Plots in DeltaWave have a rich functionality and can be controlled in various ways. This is a quick introduction to some of the basic functions
Axis Reset
Should you get in trouble zooming too far in our out, or scrolling out of range, simply press the Reset Axis button to restore the default view of that plot.
Manual control
Press the  button. You’ll see a Zoom dialog where you can enter the desired coordinates in X and Y axis, independently:
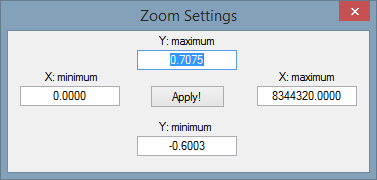
Press Apply button to see the effect of the changes you made without exiting the Zoom dialog.
Zooming in and out with the mouse
Zoom can be controlled by using the mouse scroll wheel. To zoom in on a specific point in the chart using both axis, position the mouse cursor at the desired point, and then turn the scroll wheel towards you. To zoom out, simple move the wheel in the opposite direction.
If you want to zoom in only on one axis (for example zoom-in only on the amplitude, but not the frequency), position the mouse outside the plot area, over the axis label that you’d like to zoom-in on, and then turn the scroll wheel towards you. To zoom-out, move the wheel in the opposite direction.
Moving the plot around using the mouse
To reposition the plot to a different starting/ending coordinates, move the cursor to anywhere in the plot area and then press the left button down and drag the plot in the desired direction. This allows for motion in both axis.
If you want to reposition just one of the axis, X or Y, you can position the cursor over any of the labels on that axis, and move it while pressing down the left mouse button.
Complete redo of the plots
If the charts are hard to get to the original state, the simplest thing to do without re-running the whole Match operation is to press the redo button:  . This redraws all the plots, updating all the data without doing any of the recomputation. You may still want to press the Reset Axis button if the zoom level is not restored to the desired state.