PK Metric
I’d like to propose a new error metric that I just added to DeltaWave. Due to a complete lack of product naming skills, I’m calling it the PK Error Metric. The goal is to compute a difference result that more directly answers the question of whether the difference between two devices is likely to be audible or not, and also helps pinpoint where the differences are likely to be more audible in the recording (may help pass ABX tests). It’s certainly not the final word in perceptual metrics by any stretch of imagination. It’ll likely evolve over time, in no small part based on the feedback from you. Oh, and if there’s a metric already published that does exactly this, I’m happy to change the name to the correct one.
Here’s the discussion thread for PK Metric.
DeltaWave produces a number of charts and metrics to help find and explain any differences between two files, to measure if the differences are relatively small or large. A few current metrics are somewhat perceptually weighted, such as the A-Weighted RMS of the error (delta) file, but most are simply engineering numbers that are good for evaluating equipment, measuring relative differences, determining the cause of a specific imperfection, etc. Since many (most?) people use DeltaWave looking for audible differences, the lack of a more perceptually-accurate metric has been on my mind for a while.
What is PK Metric?
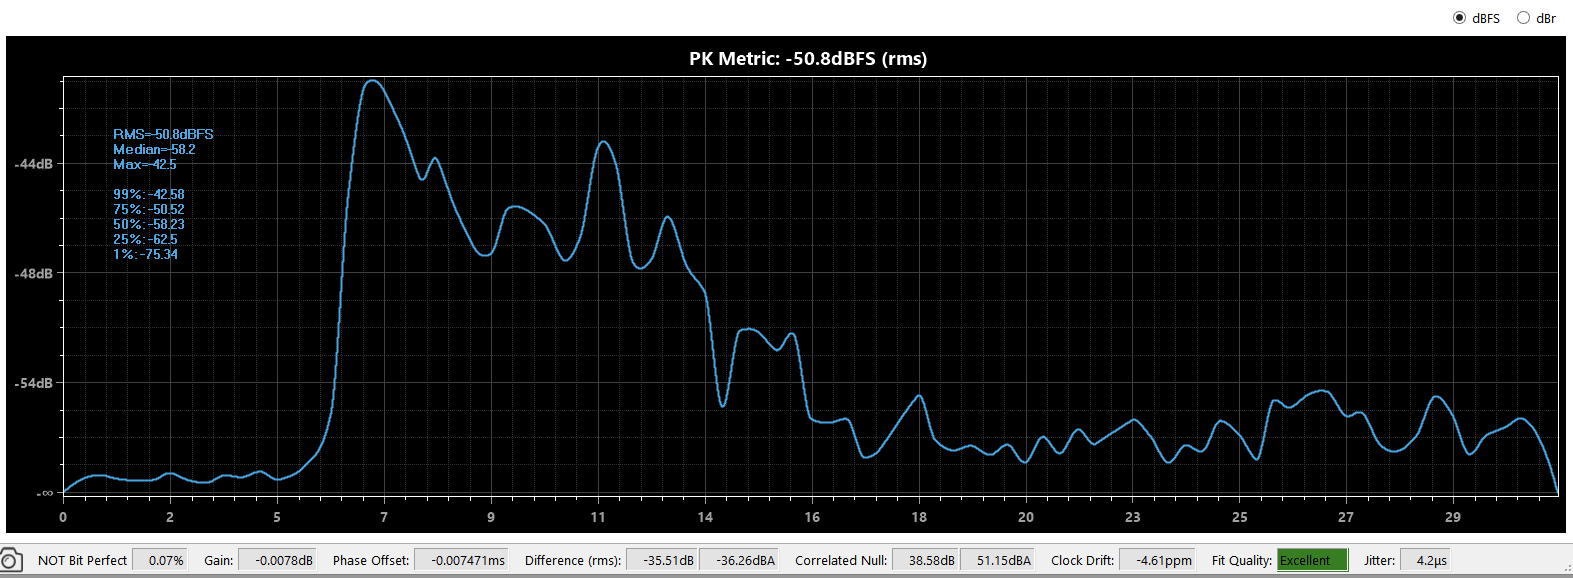
The metric itself is either a single RMS number or a chart, expressed in dB over time. While this is similar to the error signal in time domain, PK Metric is computed in the frequency domain over multiple, overlapping time windows of 400ms each. Here’s what this looks like in the final result:
For each 400ms time window an STFT (Short-Time Fourier Transform) is performed for both, the reference and the comparison. The spectra of the two windows is corrected using equal loudness curves. This step uses an interpolated version of ISO 226:2003 curves and is designed to adjust the frequency weights according to their audibility at the current playback level. The level is estimated from the sound energy computed for each of the two windows being compared. For example, a 20kHz frequency will be weighted a whole lot less than 3kHz. I’ve thought of but not implemented a lower-threshold cutoff filter… Maybe something to discuss.
The adjusted frequency responses are then reduced using an ERB (Equivalent Rectangular Bandwidth) smoothing filter, and finally, each of the ERB buckets in the comparison is subtracted from the same ERB bucket in the reference. The energy of the resulting error spectrum is then summed to produce a single dB value representing how loud the error is at that particular 400ms interval. Because the original file samples are in dBFS, the PK Error Metric result is also in dBFS. An option is provided to also display the result in dBr, relative to the total energy level of the window. dBFS value tells you how loud the error signal is relative to the maximum sample value, while dBr tells you how loud it is relative to the actual signal (music, for example).
What’s different?
Versus the RMS difference value already reported by DeltaWave, PK Metric represents a much more perceptually-weighted result. In many cases, it will be closer to the A-weighted difference (dBA) than to the RMS value, but in a lot of cases, it will be different there, as well.
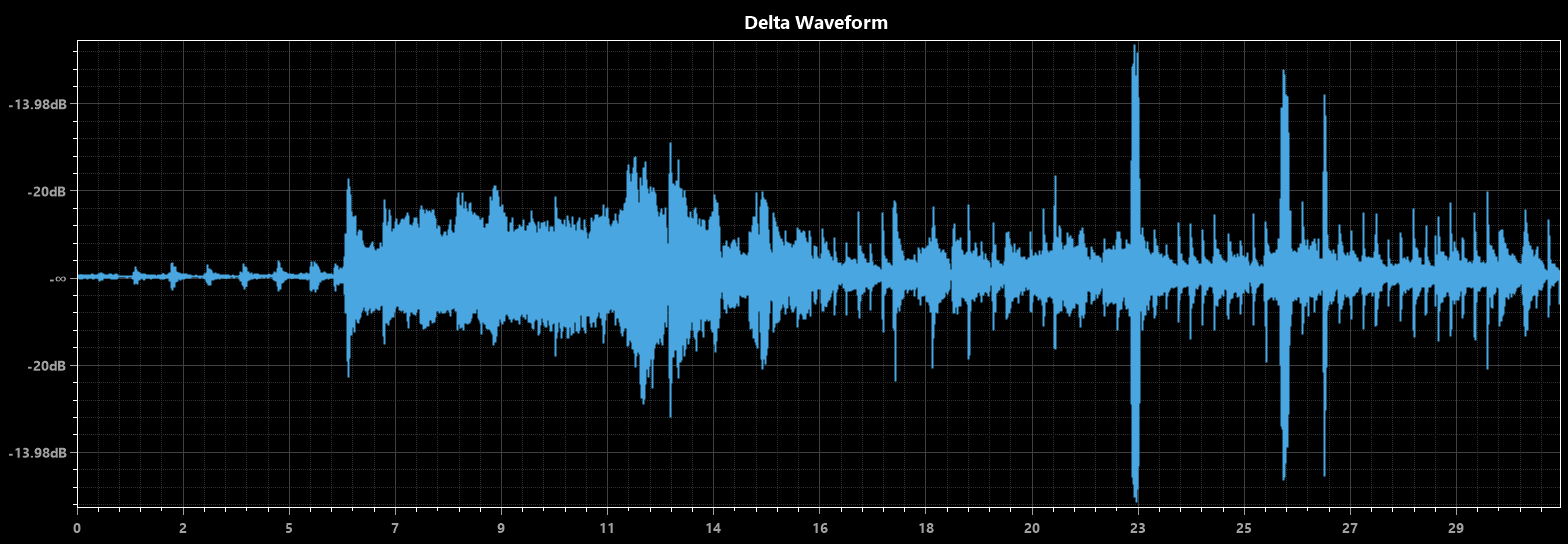
Unlike the error waveform plot, PK Metric is much easier to read. For example, in the plot above it’s pretty obvious that the error will be more audible just before the 7sec mark, and then, again, around the 11 second mark. Here’s what the error waveform looks like for the above test, try to interpret this for audibility, and you may be picking wrong!
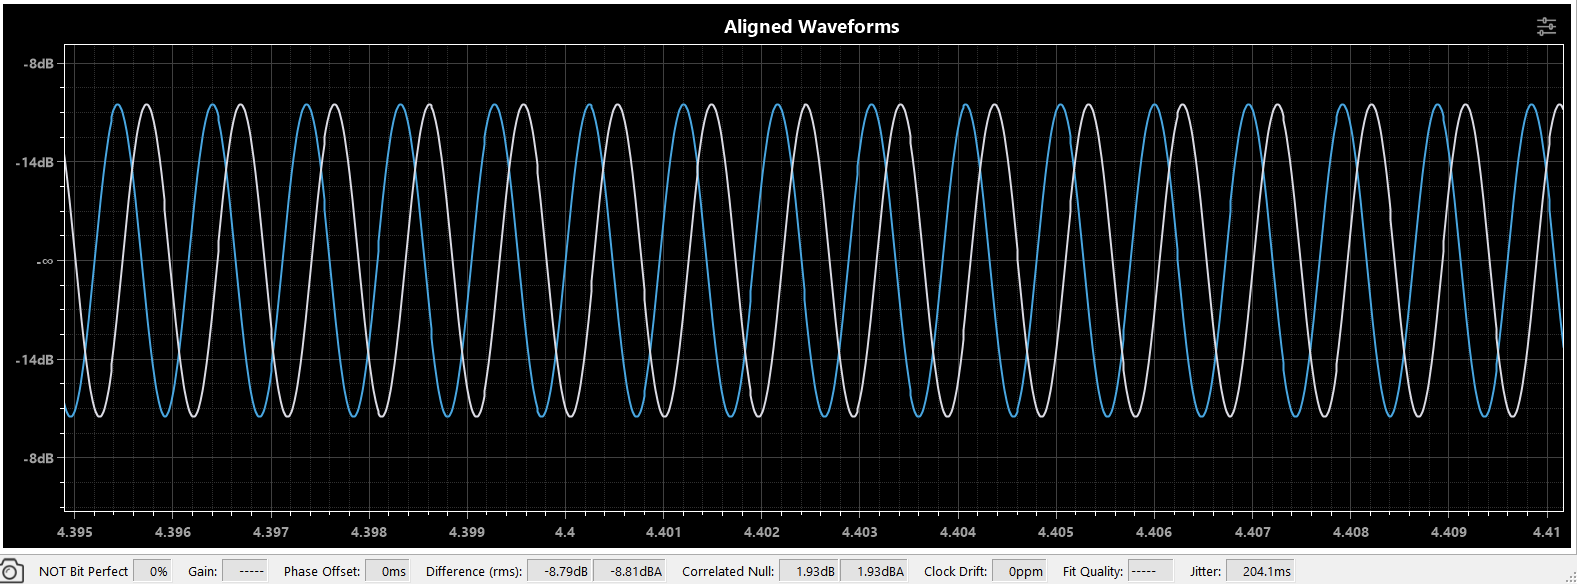
Unlike the DF Metric proposed by Serge Smirnoff, PK Metric is not confused by small errors in timing or noise. For example, here are two 1KHz sine waves at different time offsets, at the same level, showing the delta waveform and the RMS null values. The naive RMS difference is very large, -9dBFS, since these waveforms are not aligned in the time domain. This may be mistaken for a very large, audible difference. And yet, the two sine waves at the same level and frequency really should sound the same!
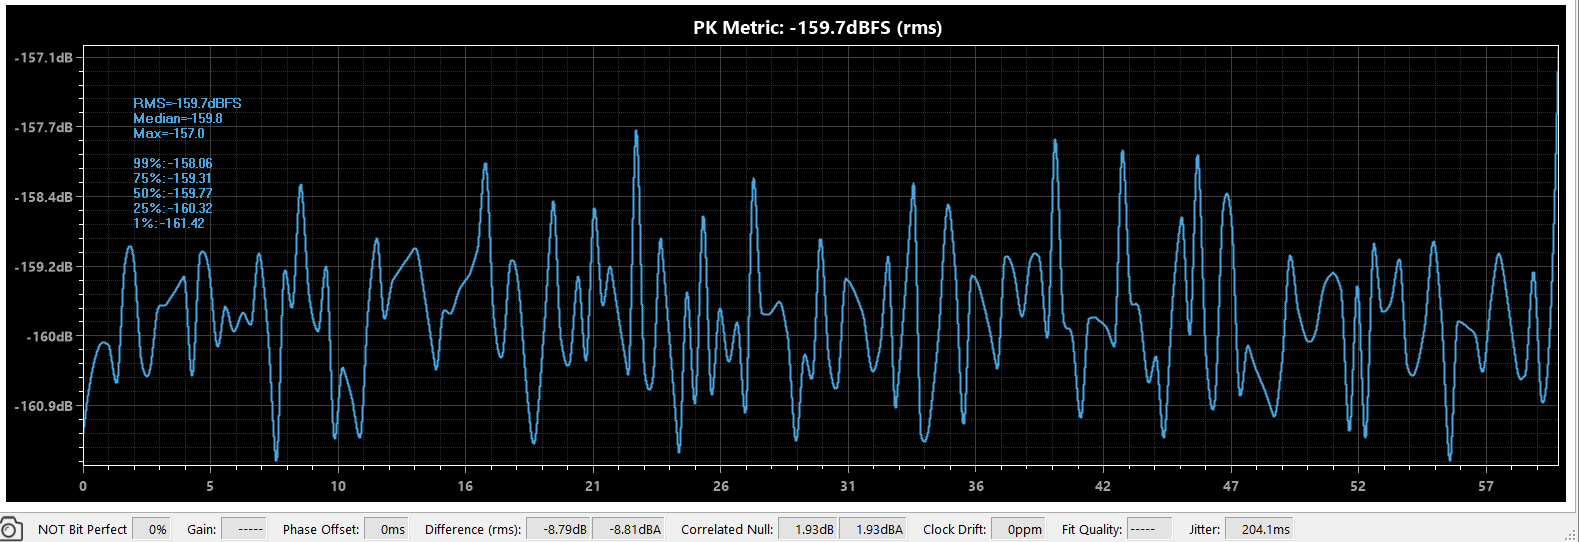
Here’s the PK Metric, doing the comparisons in the perceptually-weighted frequency domain. The result is nearly -160dB, and therefore completely inaudible:
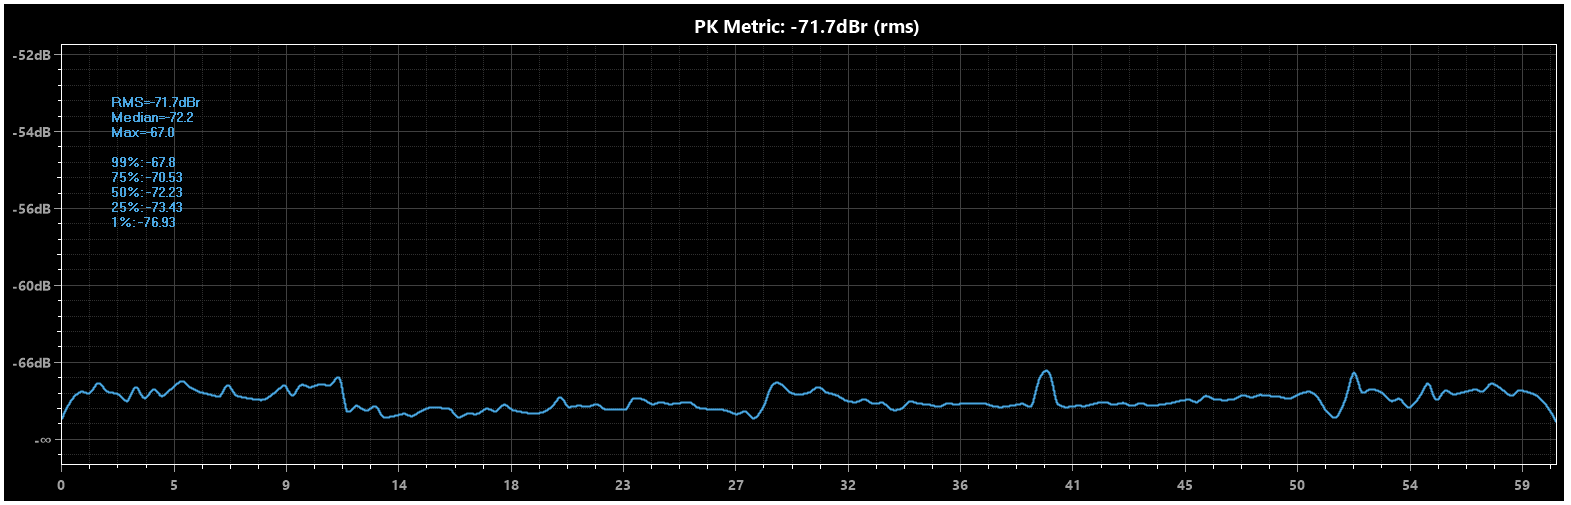
Another example, the reference original 44.1KHz WAV file was low-pass filtered at 19KHz in Audacity. The comparison looks like this (RMS null of only -48dB):
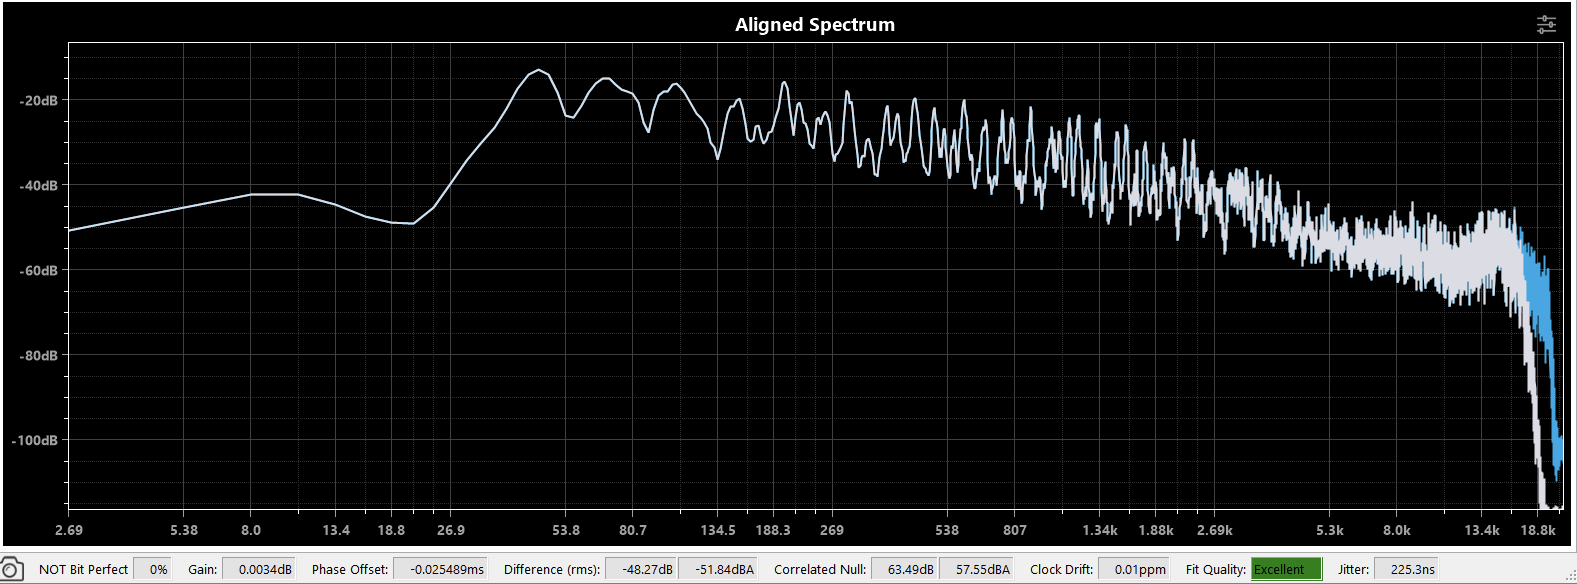
And its perceptually-weighted PK Metric is at -72dB, more than 30dB down from the RMS null difference, indicating this is unlikely to be audible:
This result is much more of what one would expect, since the test signal is recorded music with not much happening above 19KHz, and, of course, human hearing not being sensitive at those frequencies.
Is PK Metric useful?
That’s something I’m hoping to hear from you. Your thoughts on the design, any ideas for improvements, and any of your own test results. Gearslutz DA/AD loopback thread is a great source for WAV file comparisons. But, the numbers reported in that thread are RMS of the error signal, and thus, are useful as an engineering metric, but a little misleading if you want to know if the differences between two DACs or other components are really audible. My hope is that PK Error Metric can help answer these audibility questions a little better.
All feedback and suggestions are welcome!