Quick guidelines
- Use smaller files to compare (2-3 minutes). If a file is much larger than that, try to reduce it by specifying Trim Front and Trim End values for both. These are in seconds to be removed from each file.
- Use a powerful PC: multiple cores help, larger memory (8-16GB) helps.
- Start by using files of the same sampling rate. DeltaWave will resample to match, but resampling process may affect the results somewhat. Downsampling is preferred to upsampling, and that’s the default that DeltaWave will use.
- While DeltaWave is processing, you can stop it at any time by pressing Stop button. It may take a little time for the operations to abort, so give it a few seconds.
- Charts displayed can be very large with a lot of data, so it may take some time for them to update or refresh. Please be patient!
Basic Operation
There are two ways to process files:
- Full matching mode, and
- Preview mode, with no matching
In Preview mode the files are loaded but no matching is performed. This provides a quick preview of the data and some simple analysis. Usually this is much quicker than the Full Matching mode. Press Show button to perform Preview analysis.
In Matching mode, the files are loaded, and processed (in memory - files are not written so don’t worry about overwriting!) The processing involves adjusting the waveforms to match in sampling frequency, phase, and amplitude. This is mostly automatic when you press Match button.
One channel at a time
DeltaWave uses just a single channel for comparison. You can choose L or R channel from a stereo file for each of the two selections. The resulting delta is also only a single channel. Possibly a future enhancement to be added will be to process both channels in a 2-channel recording.
Simple file preview without performing matching
If you want to just visualize the two files and get basic statistics without doing all the heavy computation needed to properly
- Launch DeltaWave
- Type the reference file name with the complete path (or click on Reference button to pick it). Select .WAV, .FLAC, or .DSF files
- Type the second file name into Compare field, or click Compare: button to pick from a list
- Click Show button to start processing
- Watch the progress bar with status on the bottom of the screen. A spinner is also going to be visible at the top right, near the Reset Axis button while processing.
- Now, click across all the various tabs to see the initial results. Not all the tabs will show results since no matching was performed. The blank tabs will fill in when matching is selected.
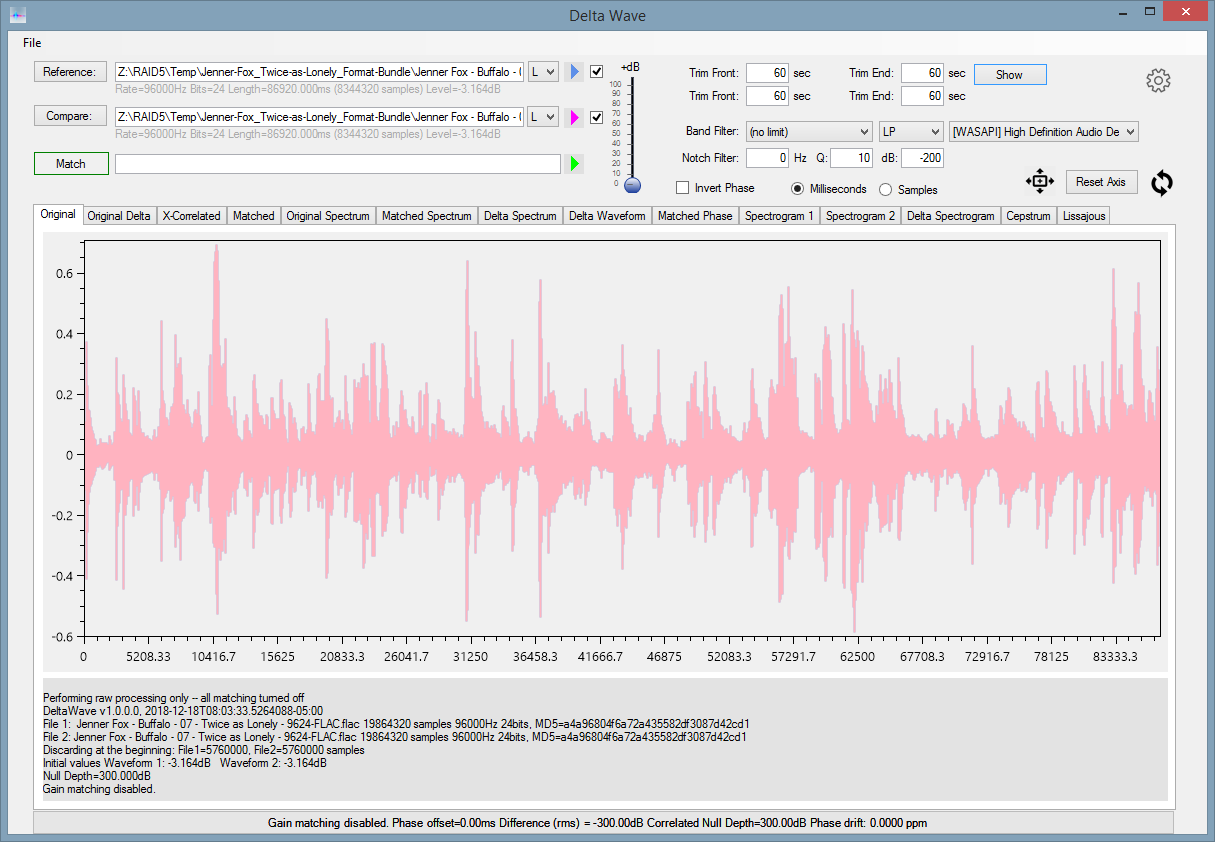
Notice that under the very first tab, there is a step-by-step result in text format providing detailed statistics of what was measured.
Matching analysis
To perform a full matching operation, simply select the two files, as before, but now press Match button. This will take a while, depending on the speed and memory of your computer, as well as the size of files you are trying to match.
Results
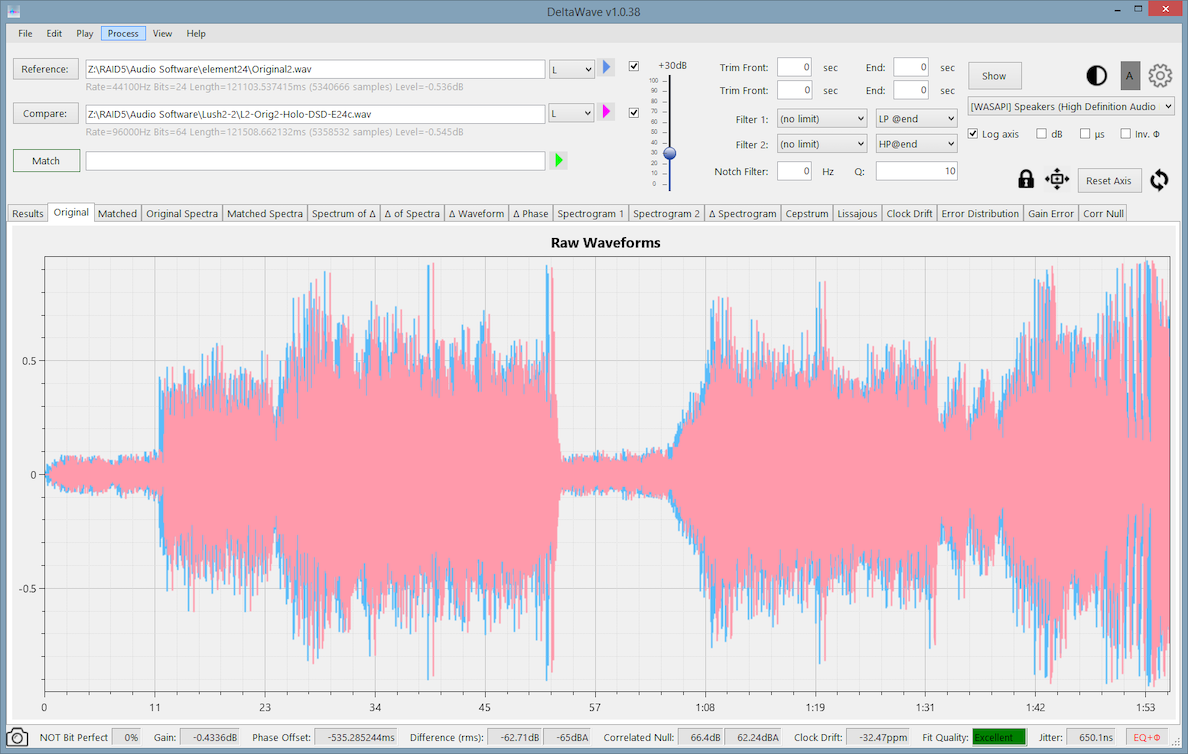
Notice the results displayed in the status below the plots, in the status. These are the parameters that DeltaWave was able to compute as the differences between the two files:
| Value | Explanation |
|---|---|
| Volume diff | (in dB) is the amplitude difference between Reference and Comparison file. 0dB means the two files have the same level |
| Phase Offset | (in milliseconds), is the fractional offset between the samples of the two files. 0 means there is no offset |
| Difference (rms) | (in dB) is the difference between the two files after phase and amplitudes have been matched, computed as root-mean-squared value. The larger the negative number, the better the match (-300dB means the files are the same). |
| Correlated Null Depth | (in dB) indicates how closely the files null each other. The greater the number, the better null match. |
| Phase Drift | (in ppm) is the detected clock drift between the two files. 0 means no drift. Any value above zero means the clocks in the two files diverge. |
Tabs
| Tab | Explanation |
|---|---|
| Original | Contains the two original waveforms, as loaded from disk. These are truncated based on Trim settings and resampled, if recorded at different sampling frequencies. Otherwise, these are not touched in any way. Blue is the reference file, pink is the compare file. |
| Original Delta | This is the waveform that results from subtracting reference file from the comparison. Again, no matching done to produce this chart, so this is an indication of how different the files are in their unprocessed state. |
| X-Correlated | First step in aligning the two files to start on the same sample. This is done using cross-correlation. The result will be a better match in time, although the accuracy is +/- one sample (not very good). |
| Matched | This is the waveform comparison after a full matching process. What’s displayed here is clock-drift corrected, level-matched, and aligned to sub-sample accuracy. |
| Matched Spectrum | Spectrum (FFT power) plot of both files after matching. This is performed on the truncated portion of the files, as specified by Trim parameters, and after full phase/drift/level matching. As such, this represents an average spectrum of each of the files. |
| Delta Spectrum | Spectrum of the difference waveform created by subtracting the matched version of Reference file from Comparison. This is the spectrum of what remains after their subtraction. |
| Delta Waveform | Time domain display of the difference between matched Reference and Comparison file. This is what the difference looks like as a waveform. |
| Matched Phase | Phase difference computed from the FFT of both files after full matching process. Expressed in degrees. |
| Spectrogram 1 | FFT power spectrum plotted over time for Reference file |
| Spectrogram 2 | FFT power spectrum plotted over time for Comparison file |
| Delta Spectrogram | FFT power spectrum of the difference of the two waveforms (the difference computed in time domain, then Spectrogram is computed) |
| Cepstrum | This is experimental! Cepstrum analysis allow ringing to be detected in the frequency domain. Spikes above zero represent ringing frequencies, the larger the spike, the stronger the ringing pattern (not the amplitude of ringing, just the quality of ring detection!) |
| Lissajous | Not sure about this one yet. Currently disabled. |